Tunisian Republic
Ministry of Transport


Climate Change


Presentation Climate Change
Climate change is a primary challenge for the Mediterranean area and for Tunisia. In order to develop adaptation strategies, it is necessary to develop scientific climate projections and to assess future climate trends.
The INM as an institution responsible of the study of the climate has elaborated an evaluation of future climate on the basis of the scenarios of the EURO-CORDEX Project, a selection of 14 Regional climate models was retained for two parameters, the temperature and precipitation. The time horizons are:
- 2050: the period considered is 2021-2050
- 2100: the period considered is 2070-2099
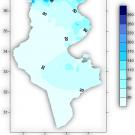
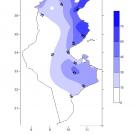
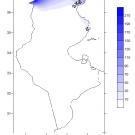
Temperature and total precipitation projections have been developed for two emission scenarios (the medium scenario RCP4.5 and the pessimistic scenario RCP8.5). The projections of the climate extremes indices were made for the pessimistic scenario RCP8.5. The spatial resolution of the models is 12.5Km.
In these projections the multi-model approach was adopted using the outputs of 14 regional models. The approach is based on using the results of several models to develop climate projections. This method takes into account the uncertainty on the structure of the different models, i.e. on the parametrization of the different physical and dynamic processes, which minimizes the uncertainty towards the results of the models while knowing that it is impossible that a single model is sufficient to account for all the situations.
The validity and scientific legitimacy of numerical climate models and their predictions of climate change are based on the confrontations between simulations and observed data. For validation, a long reliable series of observed data is essential. We used the series of the INM database (since 1950) for the validation of the different models used.
In addition, the outputs of regional climate models have a bias. To be able to use these outputs, a bias correction is essential. The INM observation series were used to make the corrections by the quantile-quantile method.
Variable acronym :
pr : Daily precipitation
tas : Daily mean temperature
cdd : Consecutive Dry Days
csdi : Cold Spell Duration Index
cwd : Consecutive Wet Days
r10mm : Daily cumulative rainfull greater than 10 mm
sdii : Simple Day Intensity Index of Rain